Overview
COVID-19 has gained increasing attention since its breakout in China in the early 2020. At this stage where full understanding of the virus is still developing, information about COVID-19 may sometimes be misleading as there is diverging, even self-conflicting, news coverage from newspapers to Internet. In our study, we are investigating which one is the most trustworthy and unbiased information source regarding to COVID-19, whether it is a traditional newspaper, or it is Wikipedia.
Dataset Overlook
There are three main datasets for our study.
COVID-19 News Articles Dataset
Since we focused specifically on COVID-19, we restricted the temporal scope of the data to news since the beginning of the year 2020, which resulted in 230,000+ news coverage. And we generated our own COVID-19 News Dataset by filtering out the COVID-19 related articles. We applied filtering keywords such as ‘COVID’, ‘virus’, ‘stay-at-home’ on the headlines of each article. This resulted in a final dataset with approximately 45,000+ articles.
Currently, there are 20 publication sources in our COVID-19 news articles dataset:
[1] “Business Insider” “Buzzfeed News” “CNBC” “CNN”
[5] “Economist” “Hyperallergic” “Mashable” “New Republic”
[9] “Politico” “Refinery 29” “Reuters” “TechCrunch”
[13] “The Hill” “The New York Times” “The Verge” “TMZ”
[17] “Vice” “Vox” “Washington Post” “Wired”
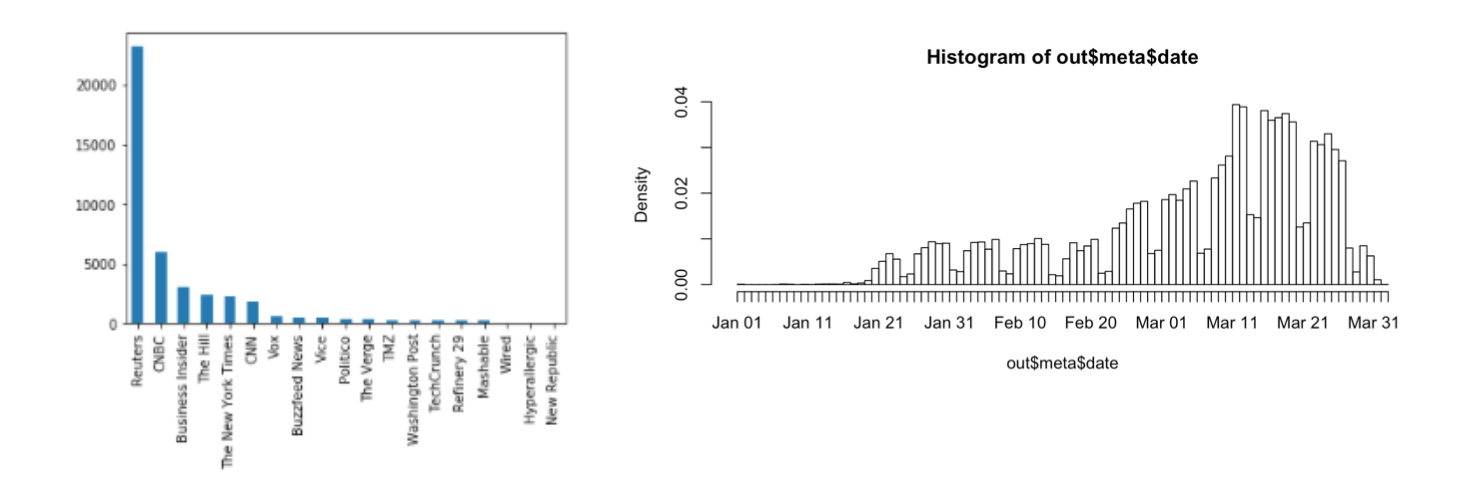
The bar plot on the left shows the number of articles per news outlet. We see that the dataset is extremely biase with the Reuters has more articles than the rest combined. Here we adapt sampling strategies to maintain fairness in the comparison below.
The bar plot on the right shows the number of articles per day, which suggests that the attention shed on COVID-19 was accelerating since March. Also, the data shows a periodic pattern since newspapers publish less articles during the weekend. There is a decreasing trend after March 21, but this is more likely because more up to date news were parsed from the Internet and were therefore not included in the dataset.
Wikipedia Page Views Dataset
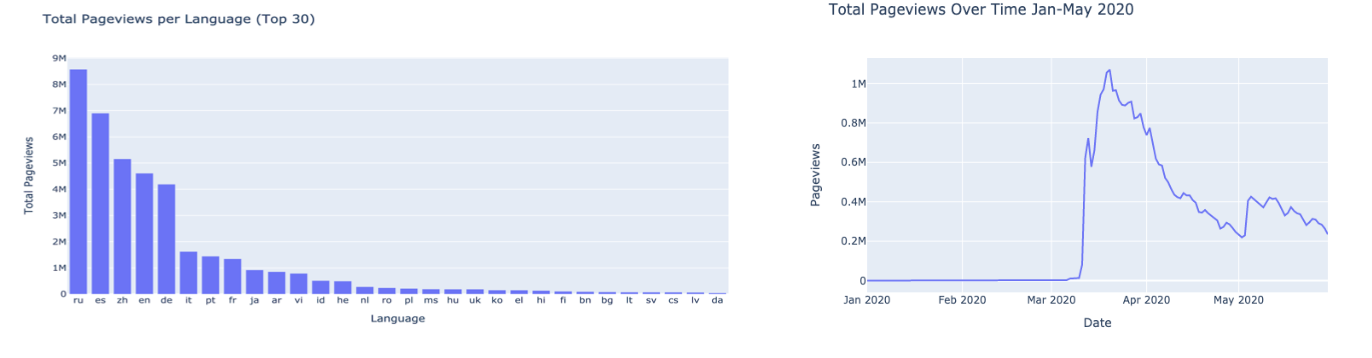
The data ingestion of the Wikipedia articles lead to the creation of thousands of csv files with the article title and pageviews for each of the articles as well as the domain code which is the language the article is written in. We narrowed down the scope of these articles by selecting the rows with titles that contain specific key words such as “covid”, “coronavirus”, “pandemic” etc. Using this much smaller subset of the data, we created bar charts to visualize the articles with the highest and lowest page views. We also created a histogram showing the distribution of the pages views for all the articles in the dataset.
Here we show that the Top3 pageviews by langueges are: Russian, English and Chinese. And the page view serges in mid-March.
Wikipedia Editing History Dataset
This dataset is the editing history of COVID-19 related pages, for example, the COVID-19 pandemic article as well as COVID-19 per country articles.
Results
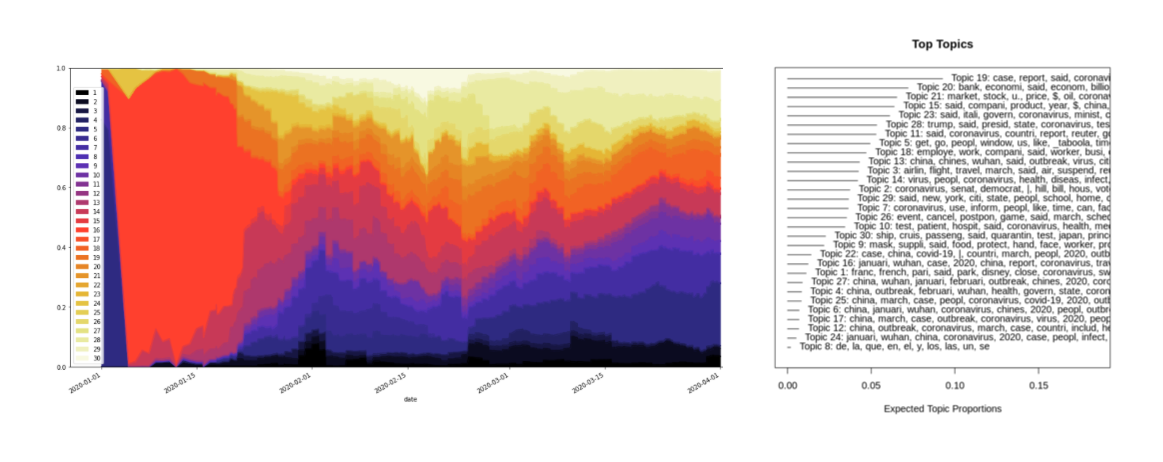
In our experiments, we run STM on the combination of both wikipedia editing history as well as the news article dataset. We first plot the overall topic distribution(Shown below) of the combined corpus and make case studies for more fine-grained analysis. Then compare the topic distribution of each source to the overall topic distribution of the combined corpus.
Here we define {T} as the set of topic distribution for a given corpus C, and Ti is the topic distribution with topic i, which is defined by the number of documents that have the dominant topic i per day. This concept would work smoothly with our COVID-19 News article dataset. For the wikipedia part, we would take the number of page views as the analogue of the number of articles for our investigation. From our perspective, the topic distribution of each source is a simple yet efficient approach in investigating the variation of content.
Topic Distribution of Specific Topics
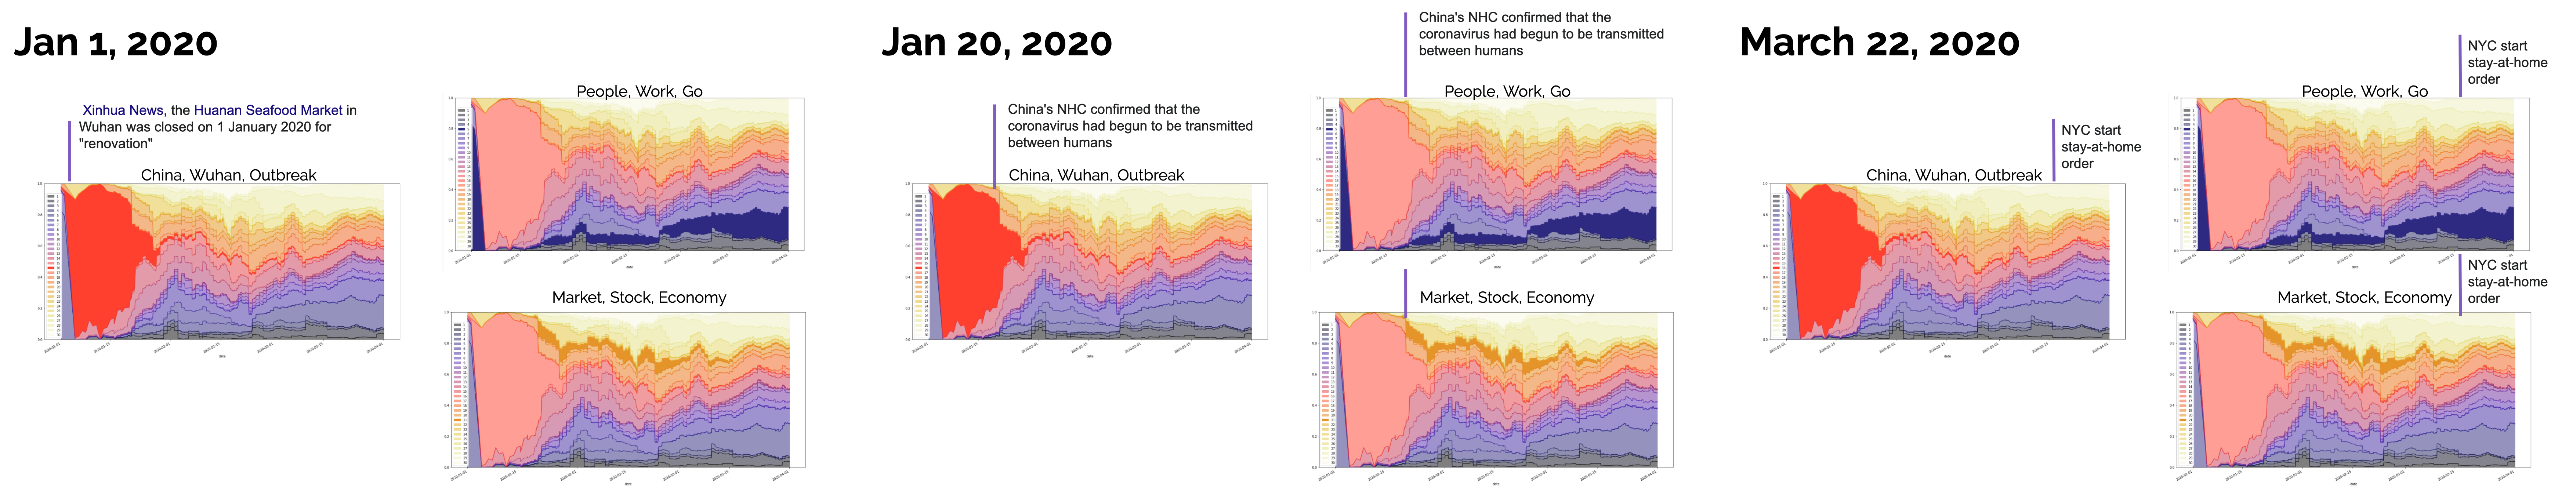
We then investigate each topic to see whether the given topic correctly reflects the ground truth regarding to COVID-19. Firstly, topic 13, given keywords of ‘china’,’wuhan’,’outbreak’, highlighted in orange, indeed correlate with the breakout of COVID-19 in China, as it surges on Jan 2020 and then decreases as the virus were gradually taken into control in China. Topic 21 on other hand, given keywords of ‘market’,’stock’,’index’,’investor’,’dollar’, highlighted in dark purple, correlates with the attention on global economy as people are concerning on the virus’s effect on the economy and the resulting Market slip.
Topic Distribution of Specific Information Outlet

The four plots above are the topic distribution corresponding to CNN, Washingyon Post, The Reuters and Wikipedia respectively. As one may observe, the Reuters and CNN is with the topic distribution that is the most similar to the combined corpus where each topic is evenly distributed, whereas for Wikipeida and Washington Post are more likely to have a dominant topic for a given period of time.
Biaseness Measurement
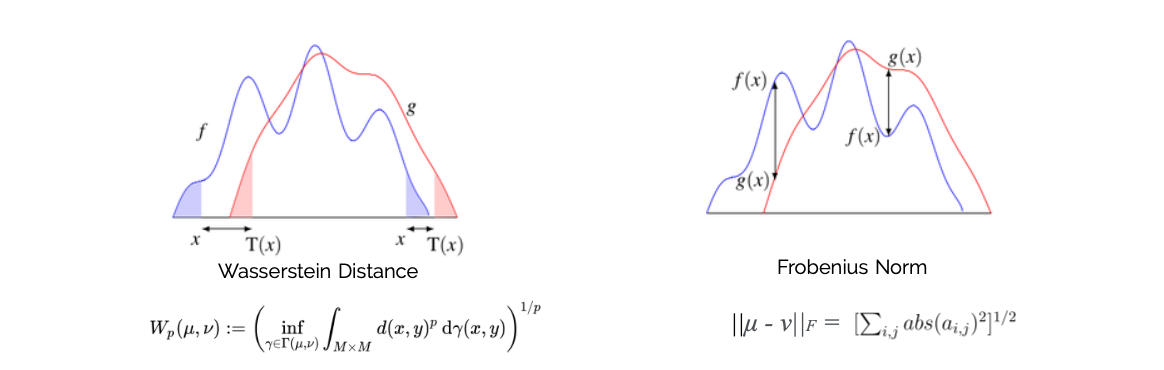
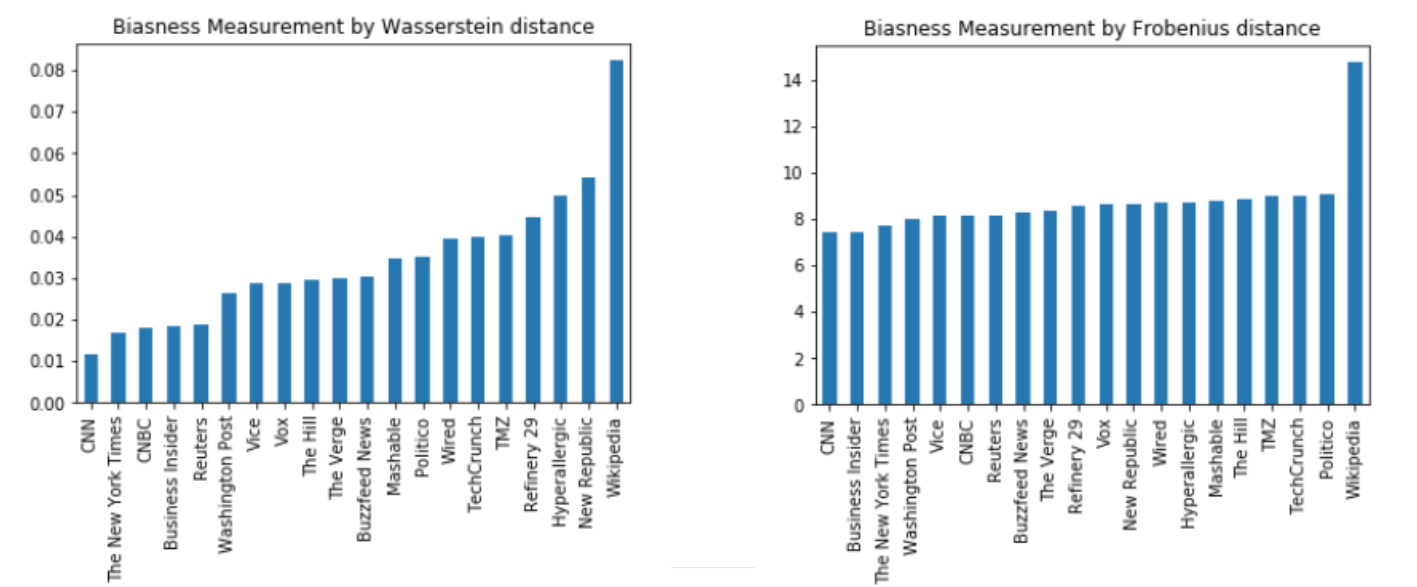 Here we define Biaseness as whether the topic distribution deviated from the ground truth, where the ground truth is the combined corpus of Wikipedia and media. Here we use two set of biaseness metric, the Wassertstein Distance and Frobenius Norm. In both settings, CNN is the most unbiased news outlet whereas the Wikipedia ranked the last.
Conclusion
In conclusion, we found out that Traditional media is the least biased, the online media comes second and Wikipedia comes the last in the scope of wikipedia, althought the rank may vary from situation to situation. In the future, we will expand the temporal scope to include more articles for better analysis.